
FOR UTILITY LEADERS
You have a dashboard.
You don't have intelligence.
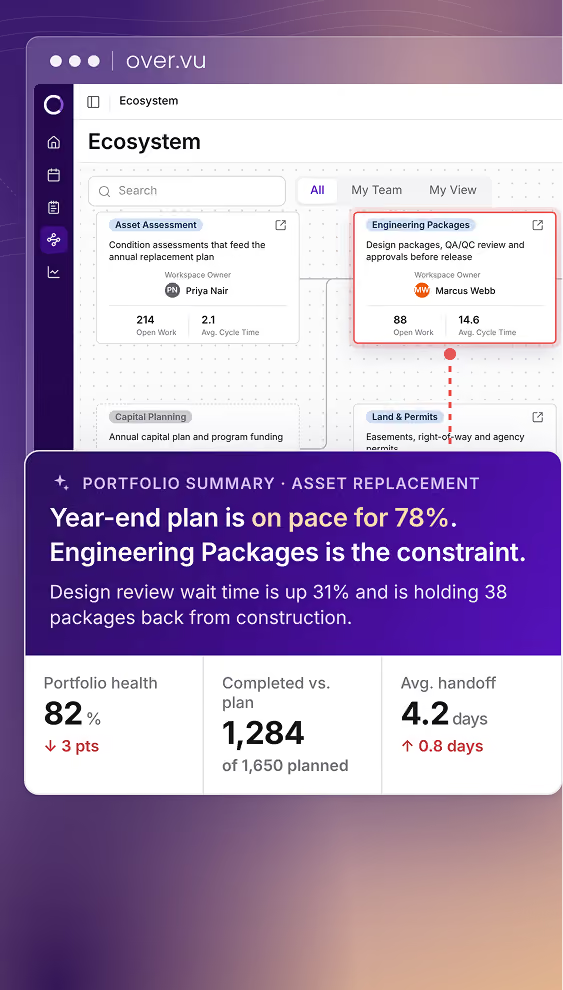
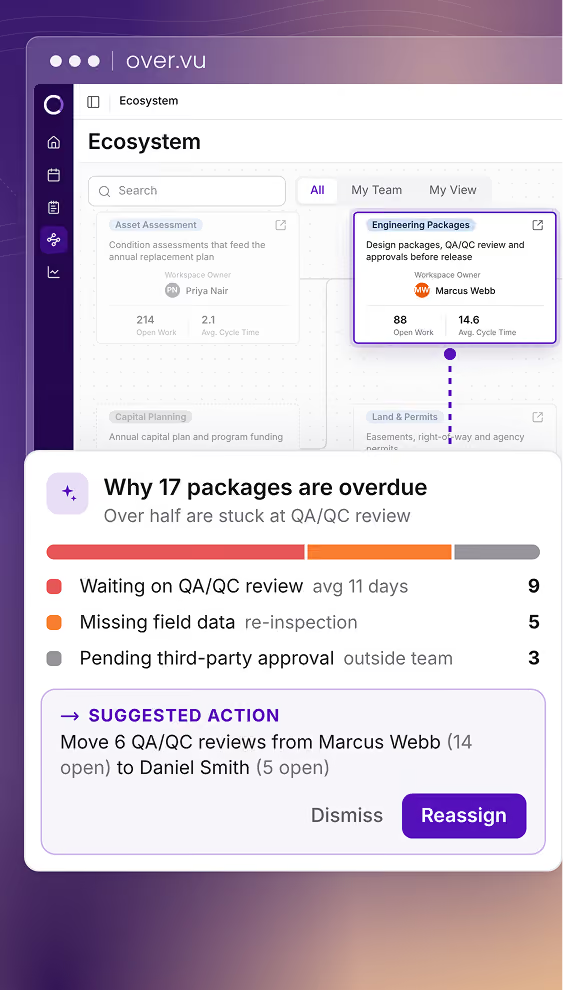
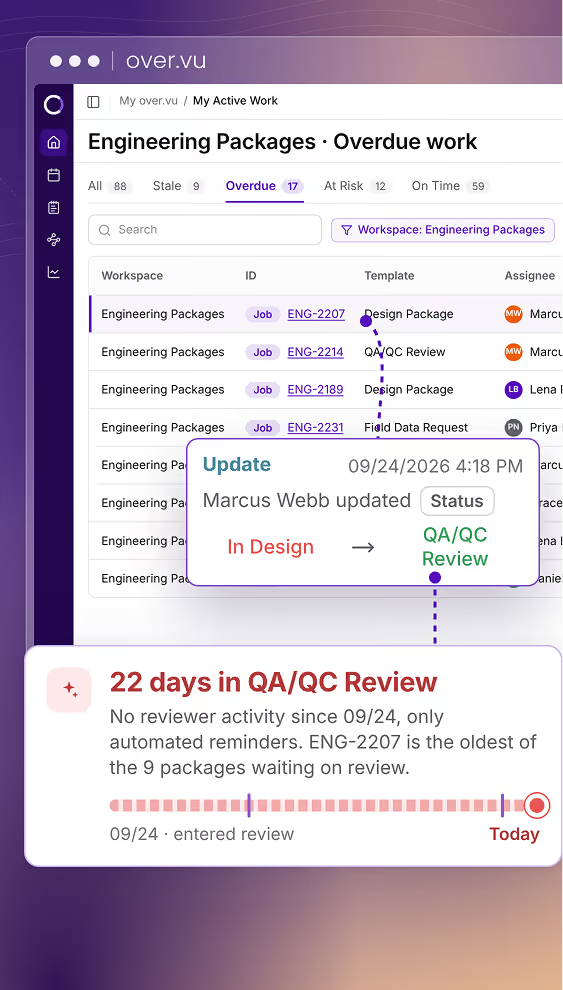
A dashboard visualizes data someone else prepared. over.vu surfaces what's actually happening across your programs — in real time, from the work itself.



OUTCOMES FROM ACTIVE PROGRAMS
What leadership-level
outcomes look like.

Work Verification
$50M
Annual savings vs ~$5M investment
Tower Assessment
$14M
Cost avoidance in a single program
Automated tracking
$13M
Asset retirement gap identified
QA programs
72%
Rework reduction
Across all users
89%
Platform activation rate
Running on over.vu today
30+
Active utility programs

Two sides of
the same platform.
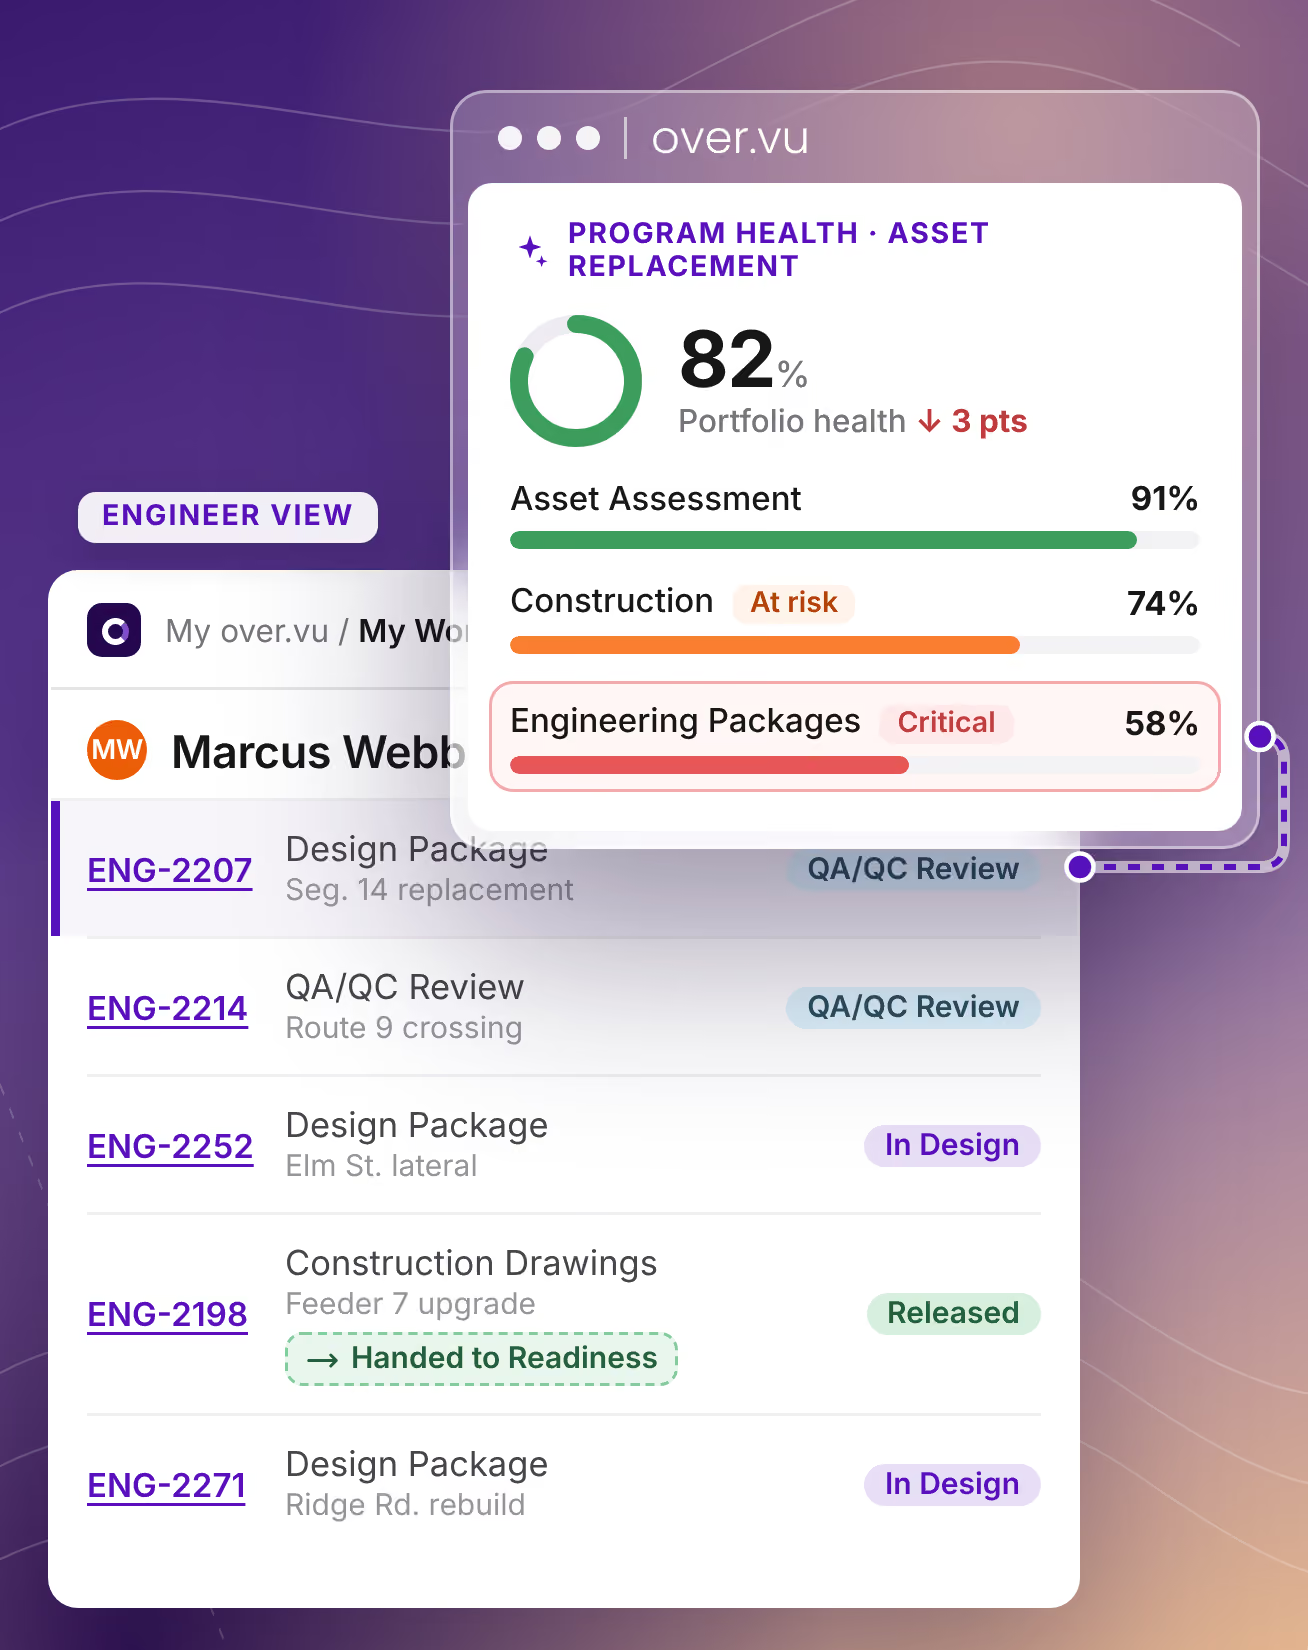
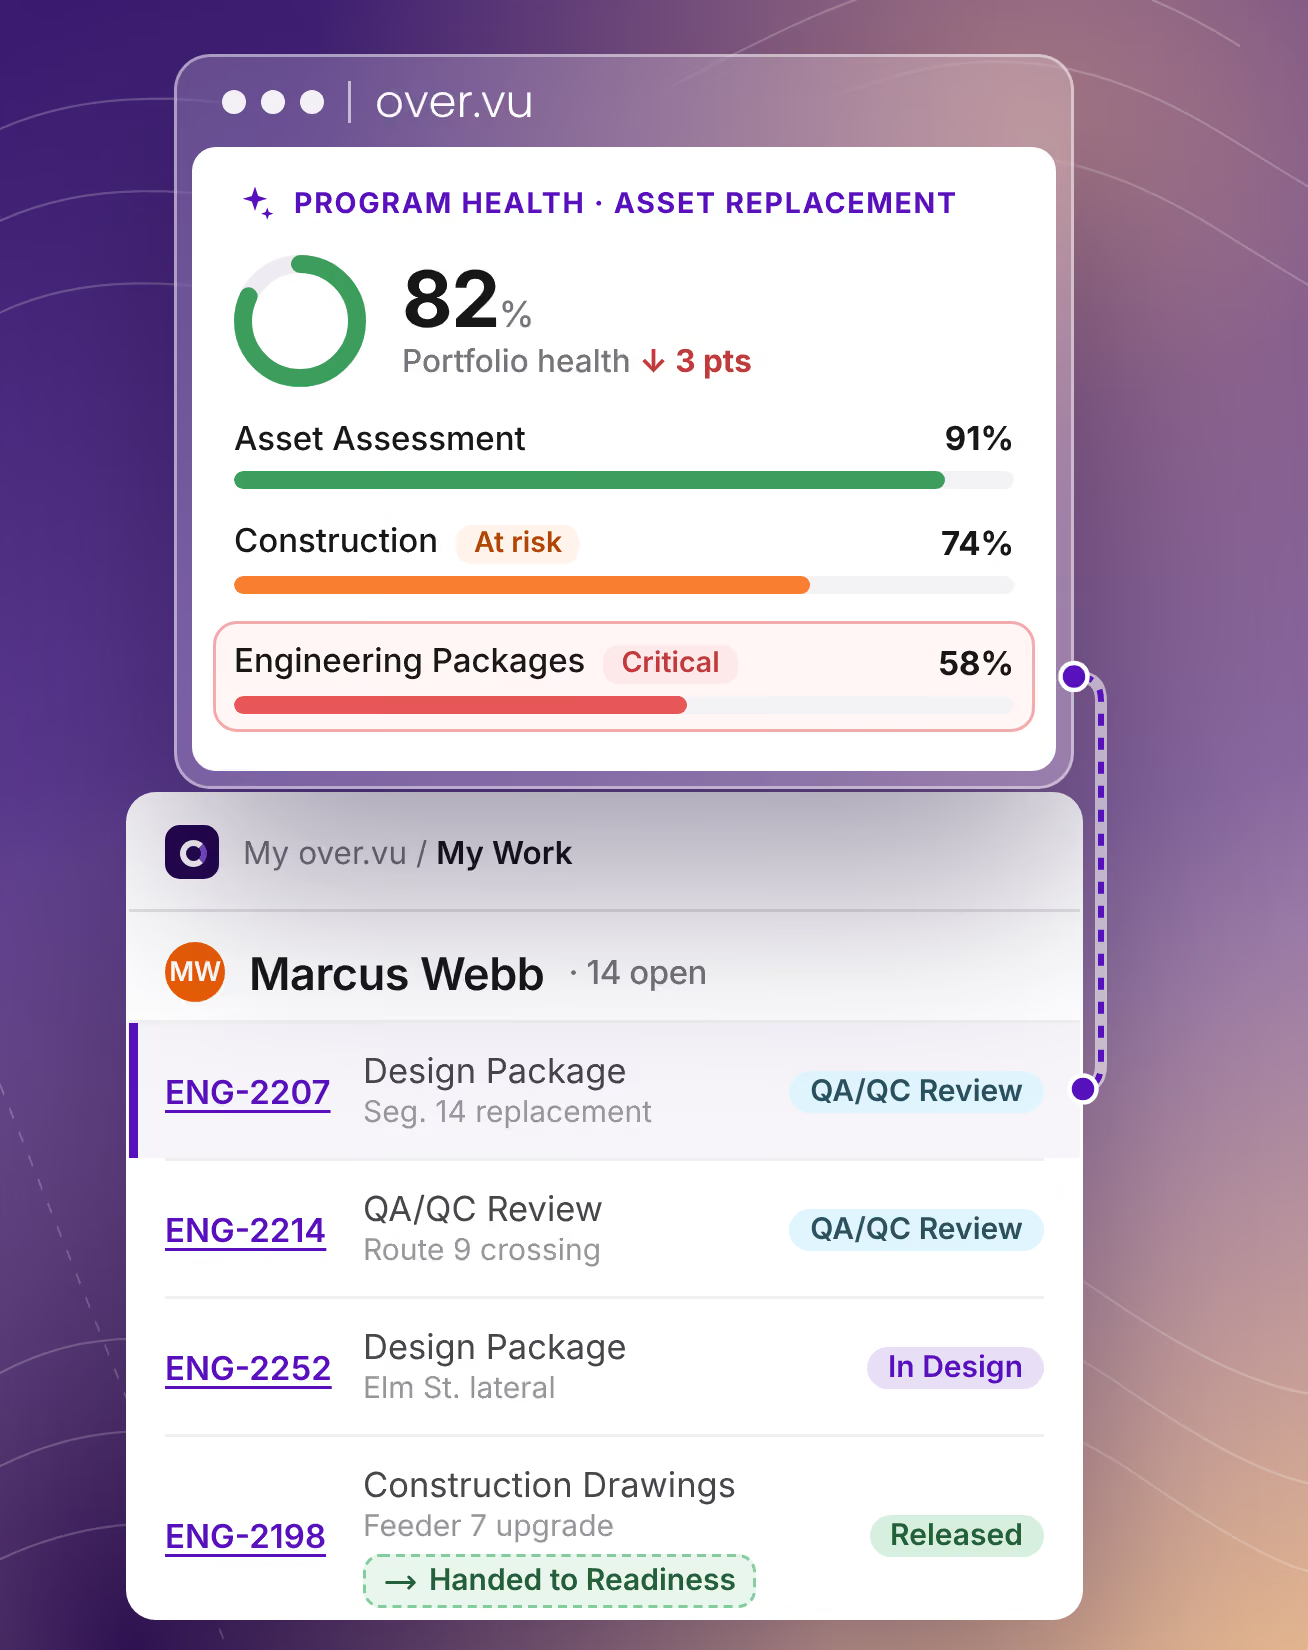
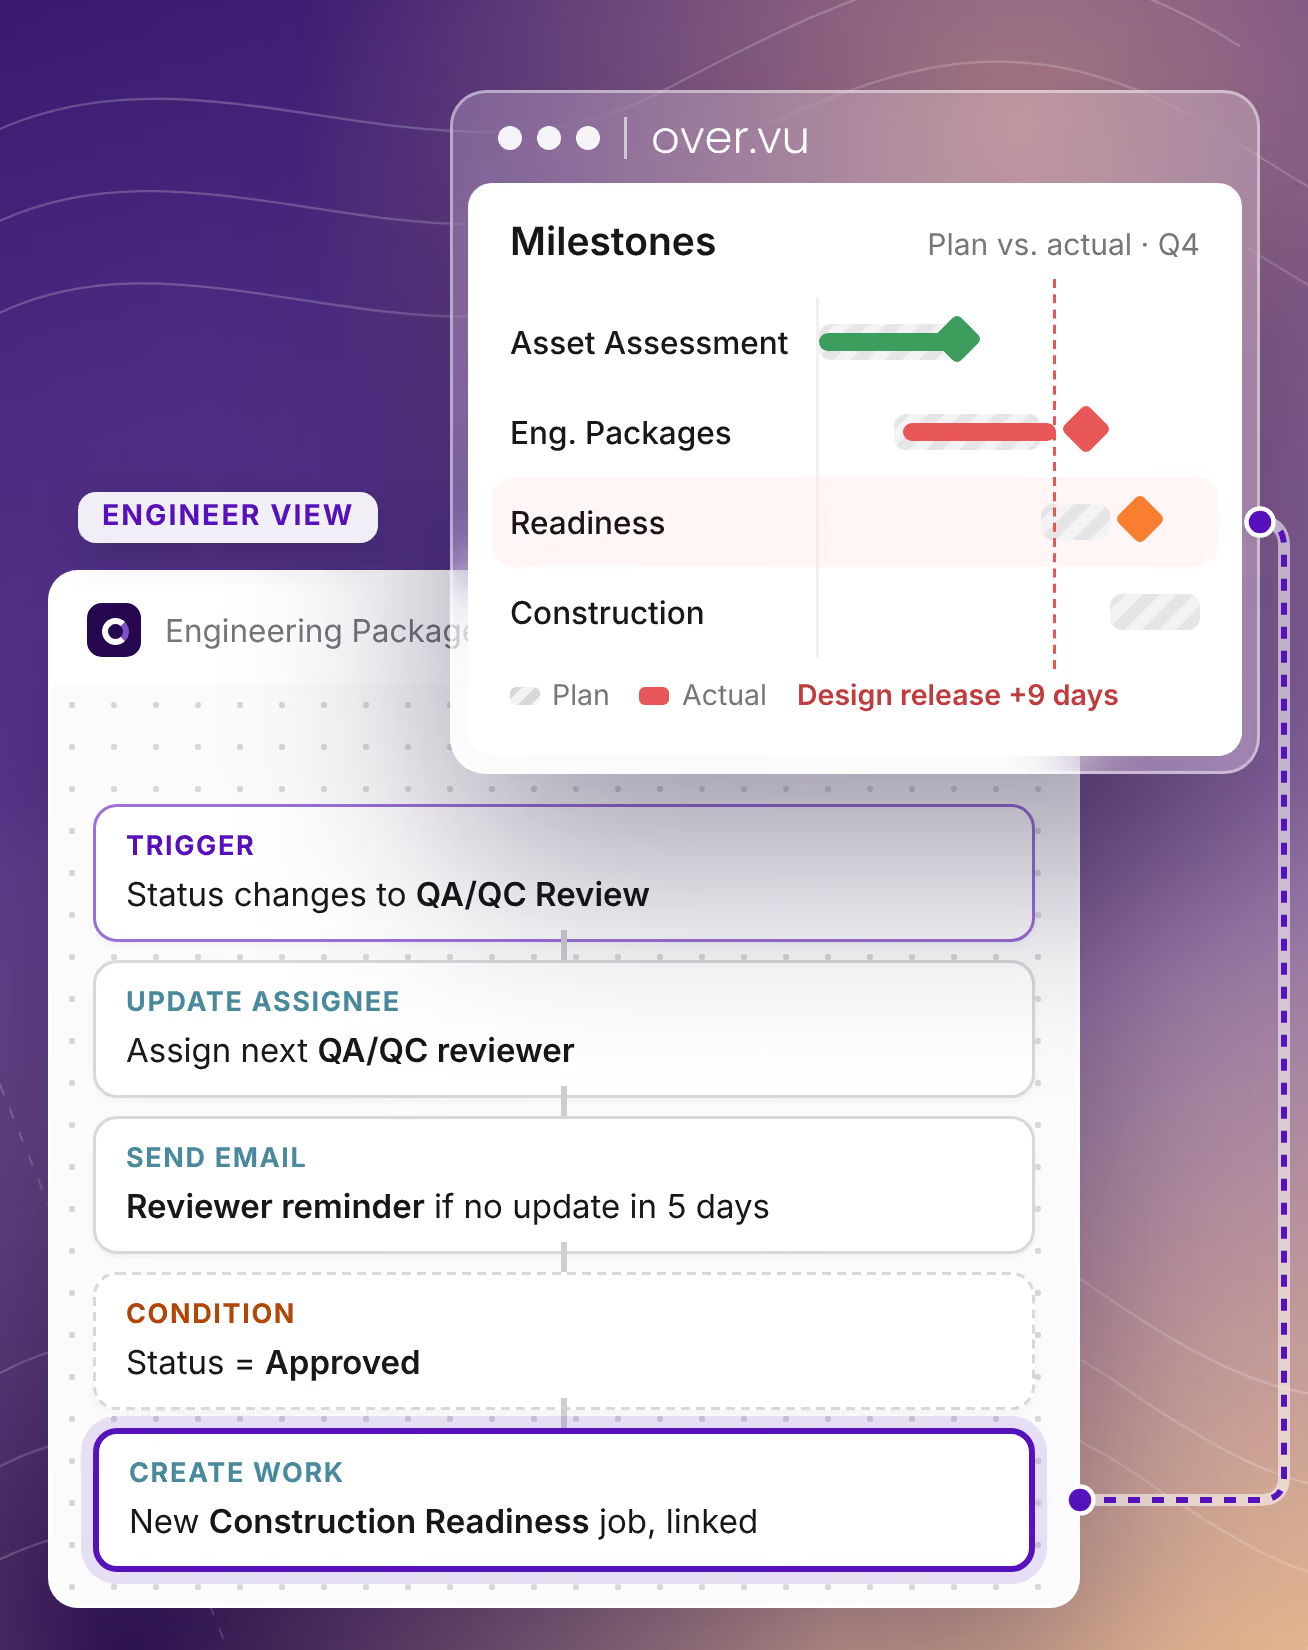
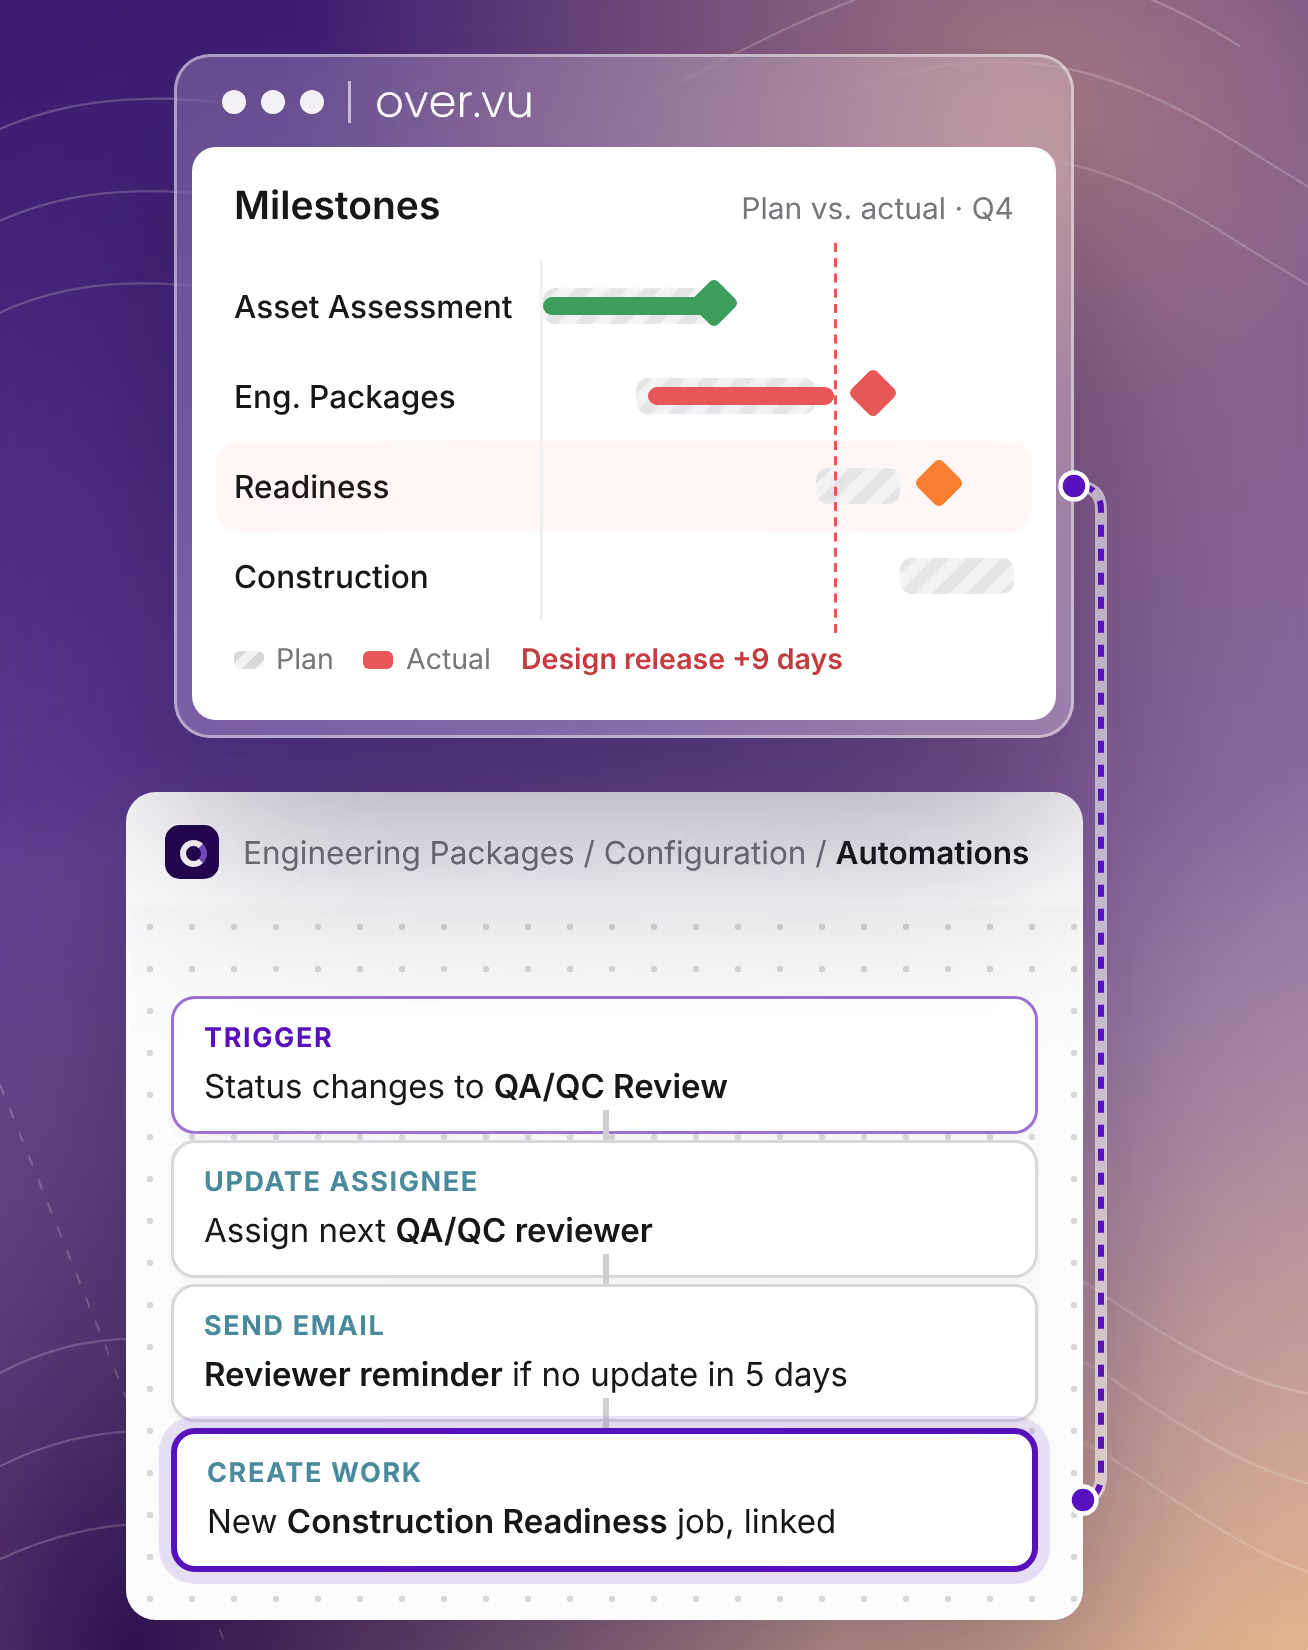
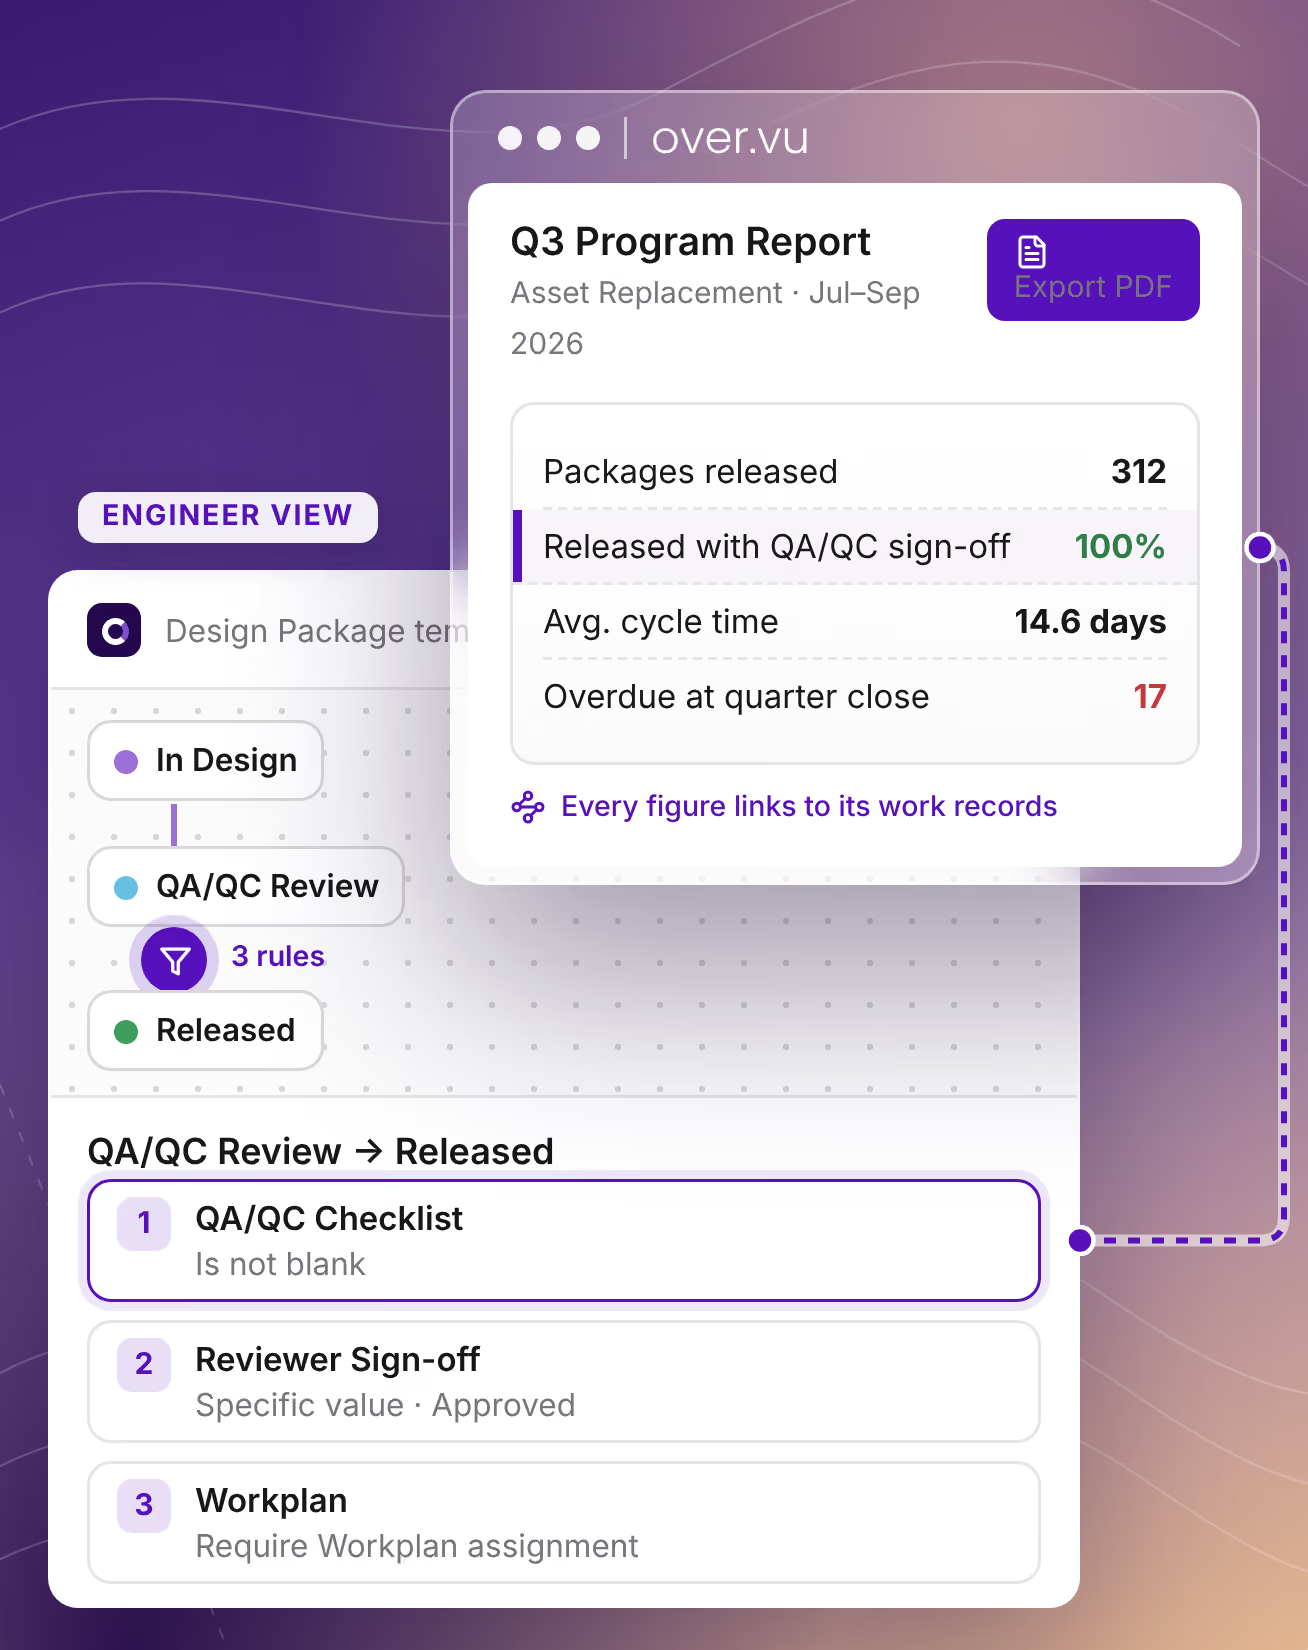
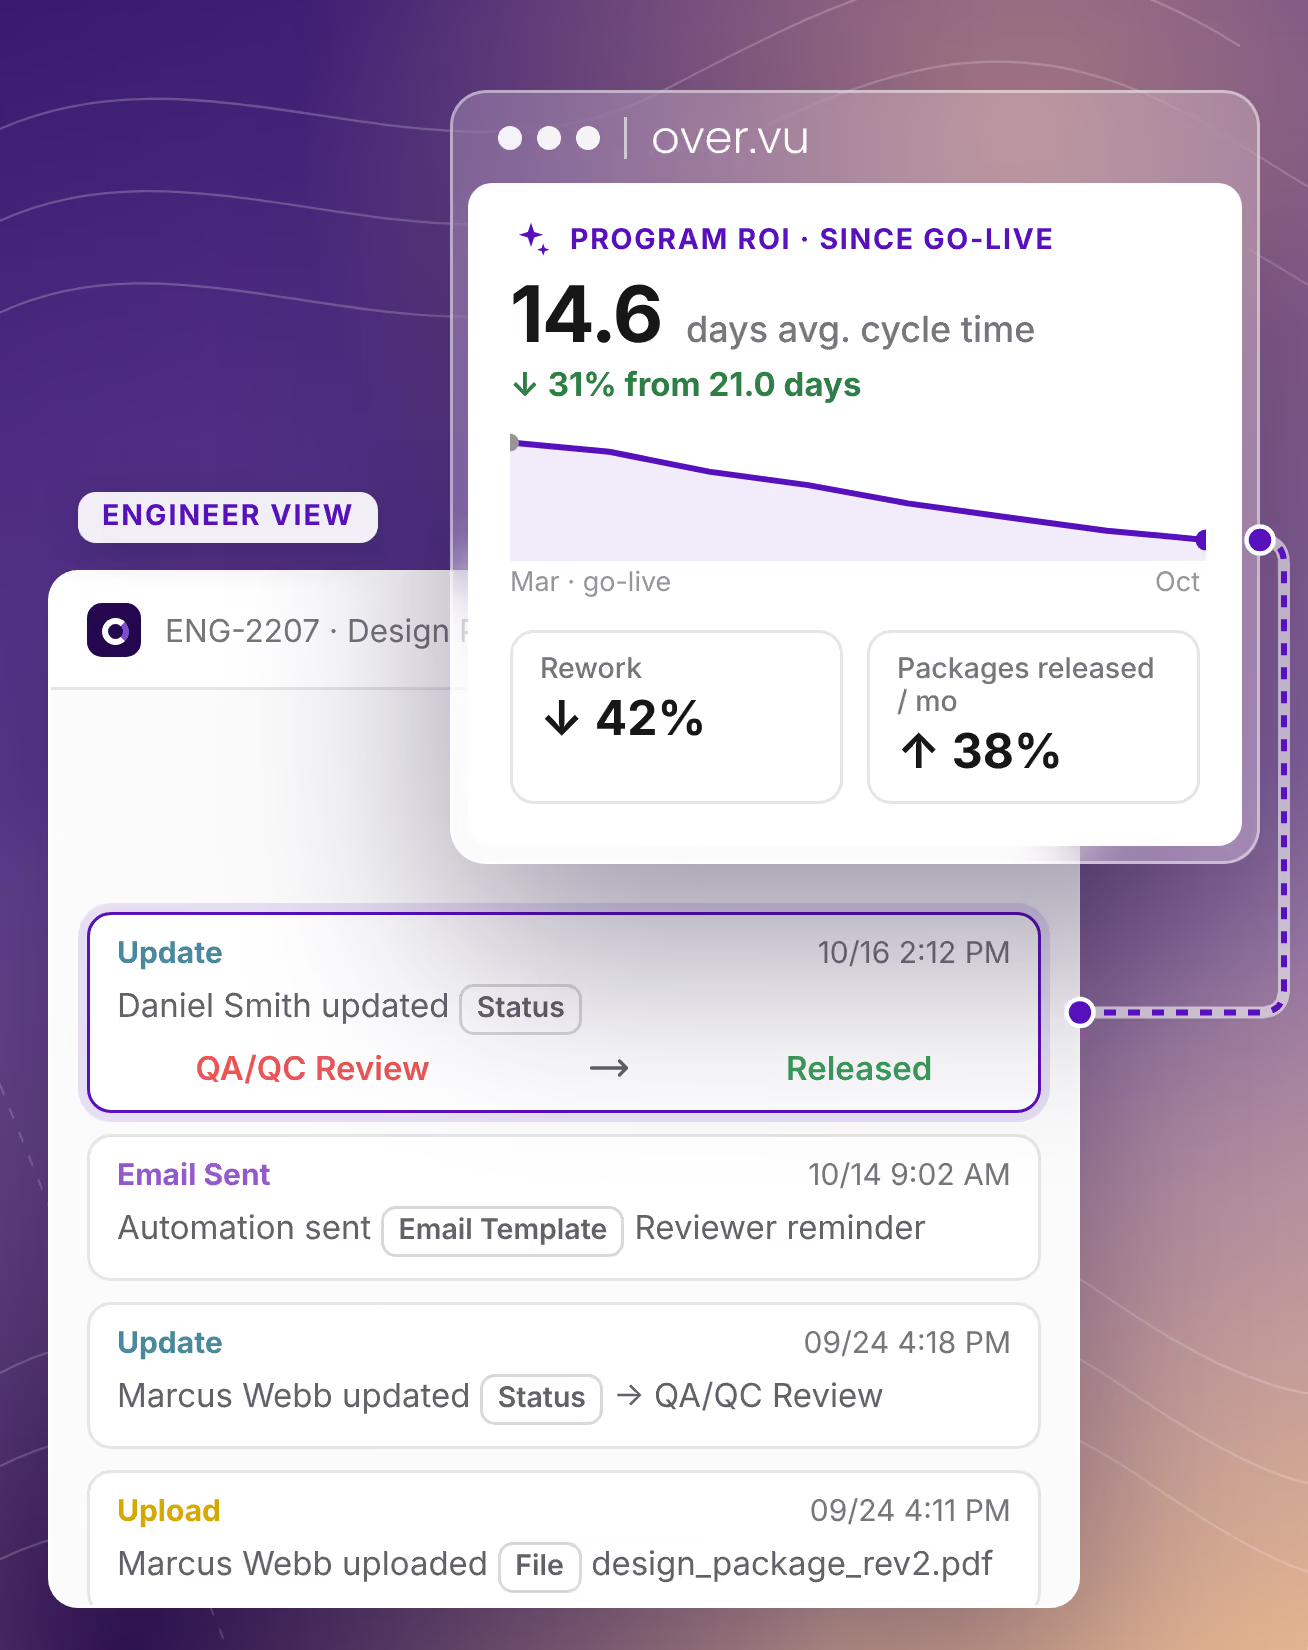
What your engineers see
Work assignments, statuses, and handoffs — all in one place
Automated workflows that keep programs moving without follow-up
Guardrails and phase gates - delegate with confidence
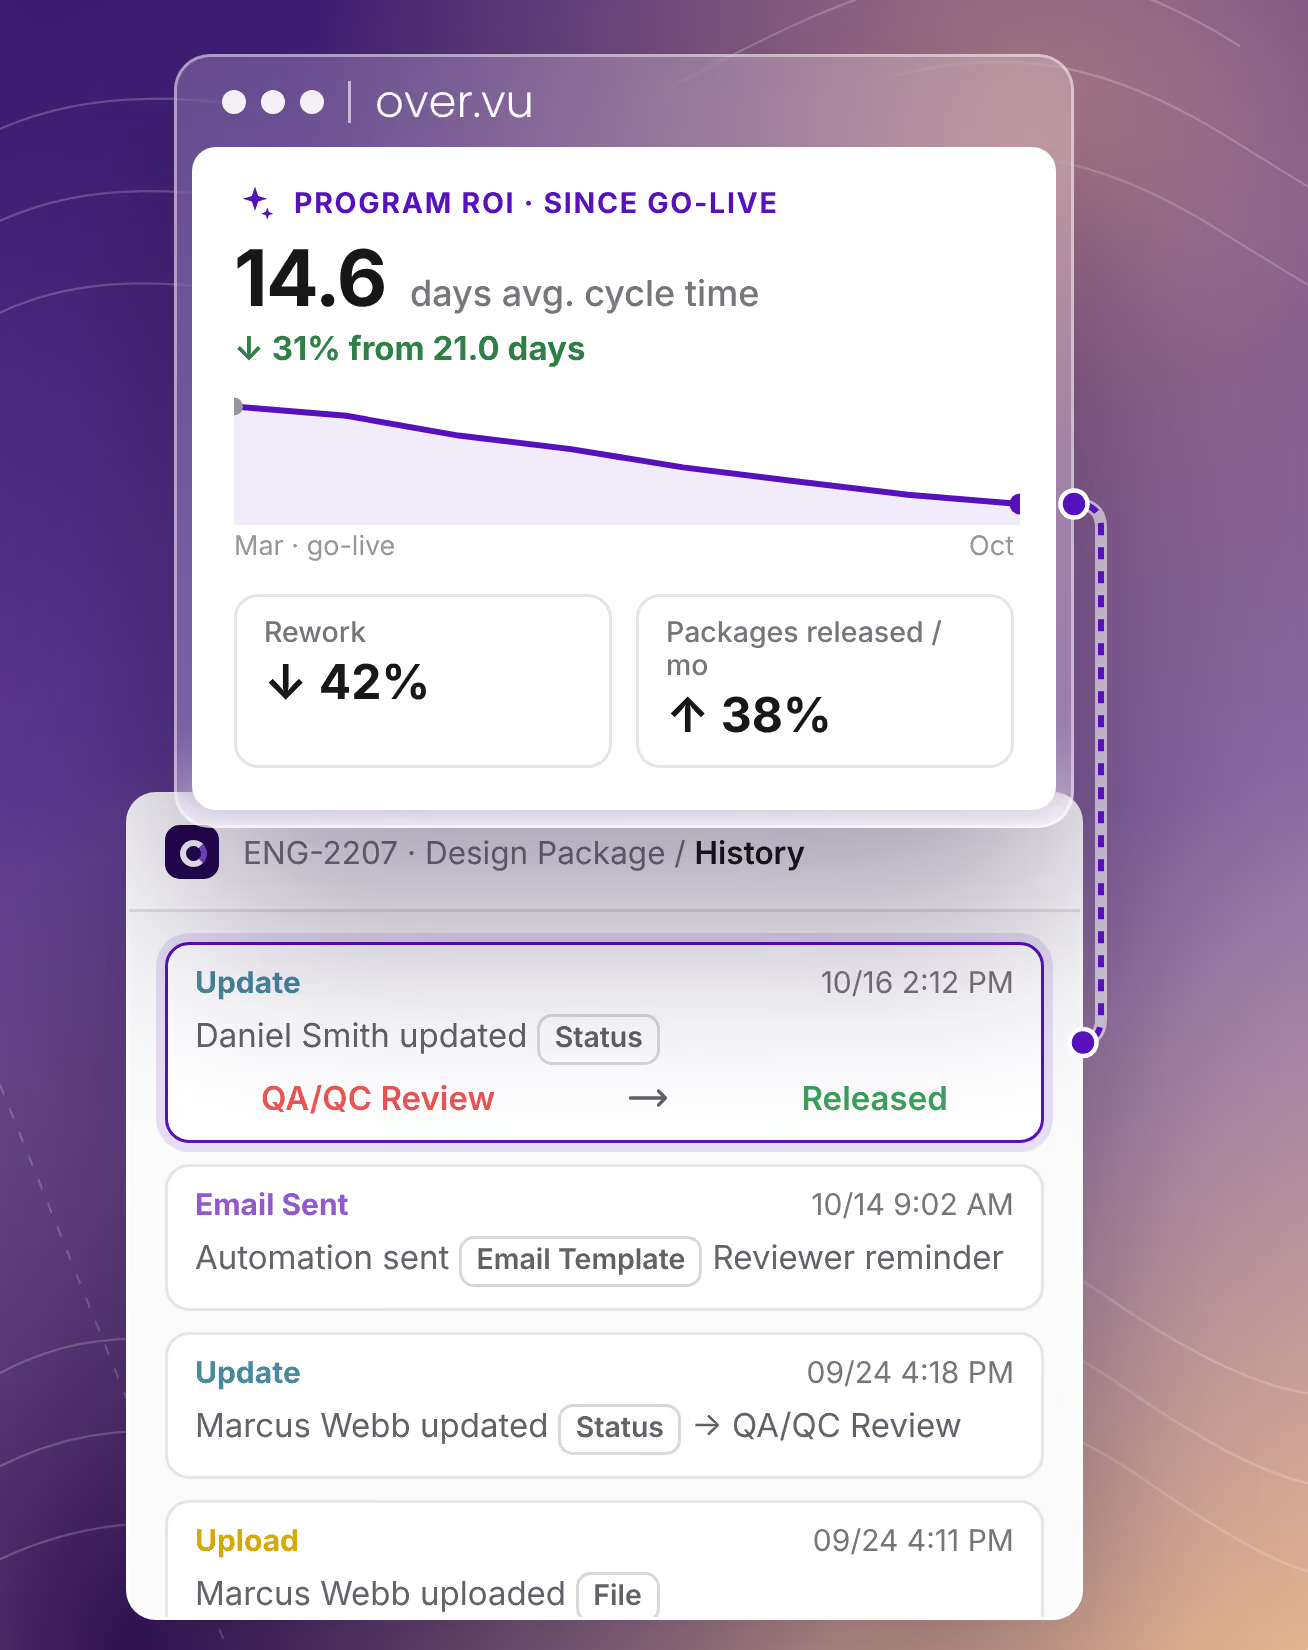
Full audit trail for every
action taken — automatically
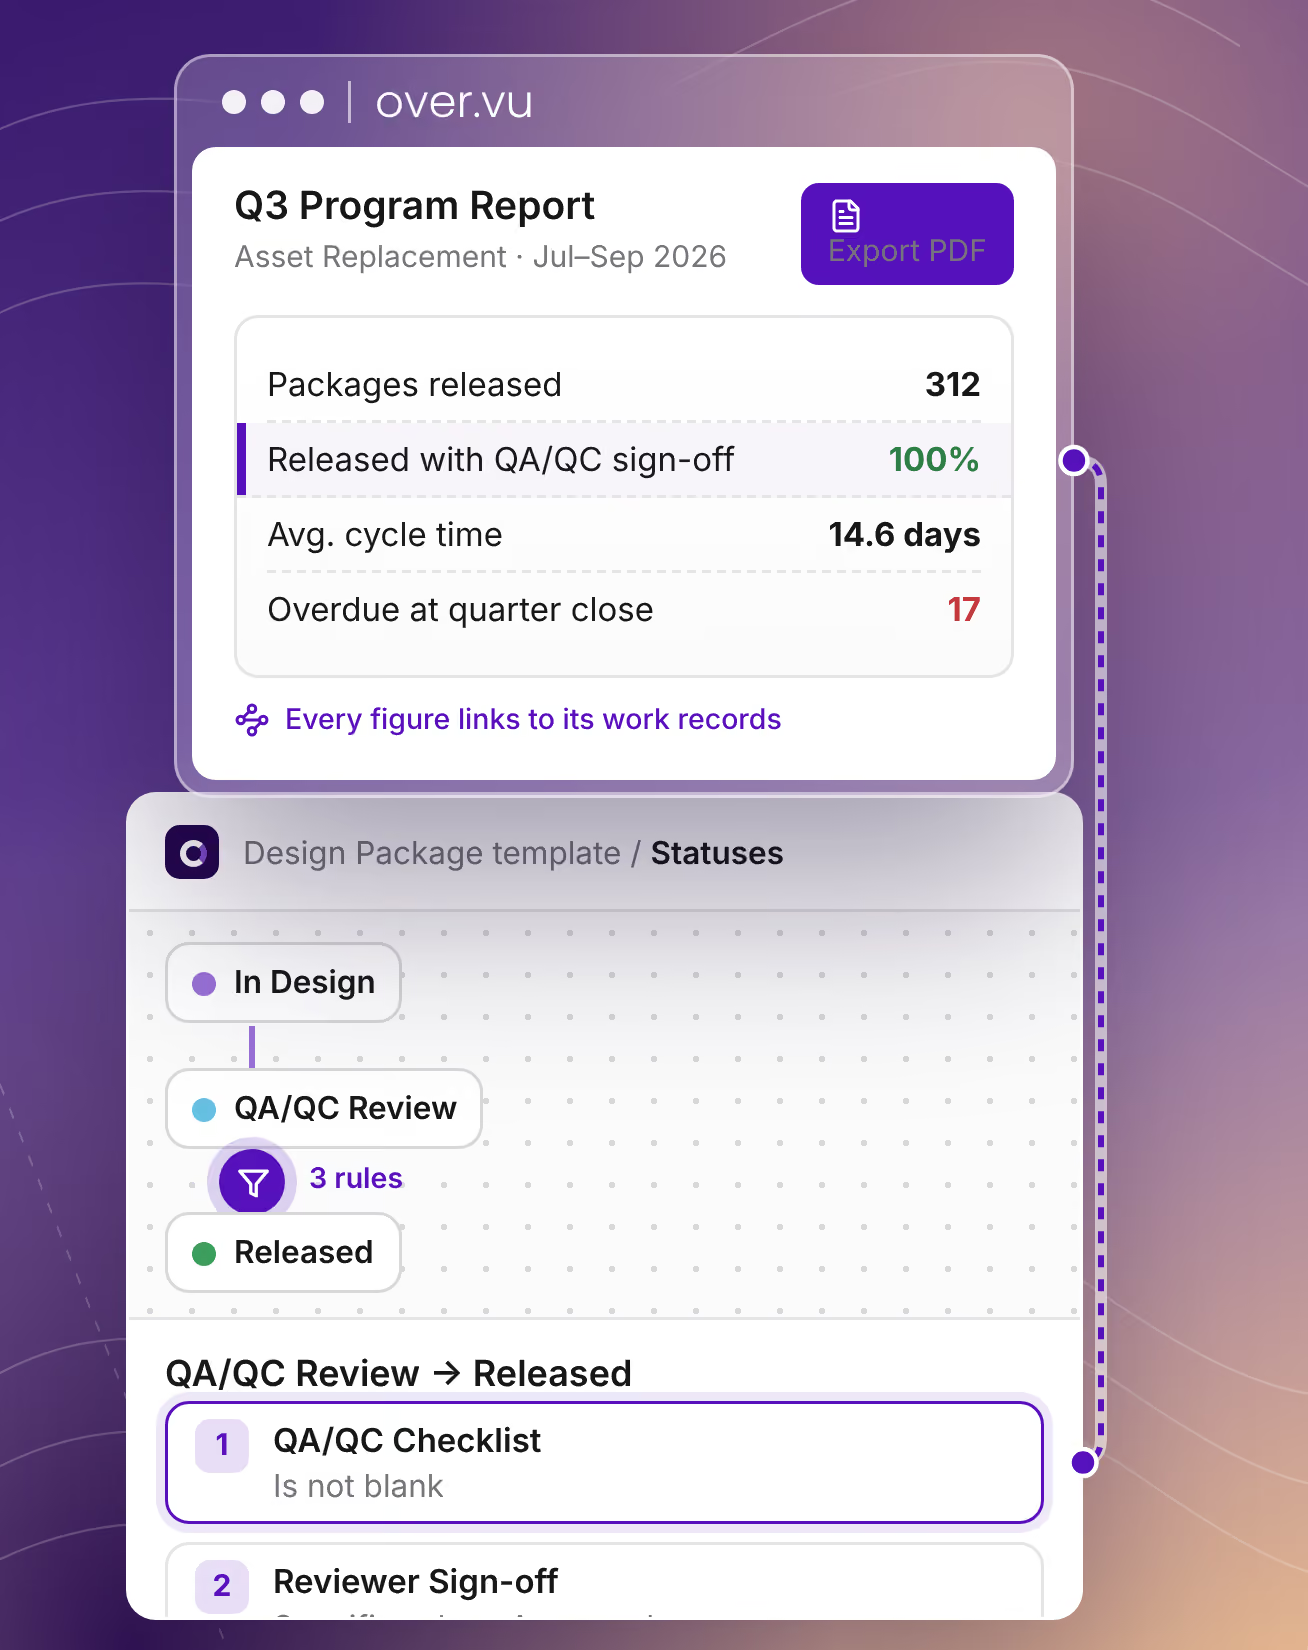
What you see
Program health across all active initiatives - no report required
Milestone tracking: where every program stands against plan
Exportable, audit-ready reporting
when regulators ask
ROI data to justify continued
program investment